Combinations of vitamin A and D are synergistic in breast cancer cells and alter gene expression in the endoplasmic reticulum stress, unfolded protein and estrogen signaling canonical pathways
March 29, 2023
Pinal N. Kanabar
Nina S. Los
Temitope O. Lawal
Shitalben M. Patel
Nisikant A. Raut
Mark Maienschein-Cline
Zarema Arbieva
Gail Mahady
1
Introduction
Numerous studies over the past 30 years have shown that bioactive compounds present in functional foods, including vitamins, minerals and phytochemicals reduce cancer risk. For example, vitamins A and D derivatives found in fruits, vegetables, and dairy products, reduce the growth of breast, bladder, head, neck, lung, prostate, and skin cancers. However, the effects of these combined vitamins have not been previously reported for breast cancer.
2
Aims
To investigate the activities of vitamin A (all-trans-retinoic acid; ATRA), as well as vitamins D2 and D3 in combination in the breast epithelial cancer cell lines T47D:A18, MCF-7, and SK-BR-3 and perform whole genome analysis in MCF-7 cells using RNA-seq.
3
Methods
Breast cancer cells were cultured in appropriate media and treated with ATRA, D2 or D3 alone in concentrations from 1-10 μg/ml, or in combination at 1, 5, and 10 μg/ml. The CellTiter-Glo® 2.0 assay, Caspase-Glo®3/7, Caspase®8, and ApoTox-Glo™ Triplex assays measured cell viability and apoptosis. The effect of treatment on autophagy in MCF-7 cells was measured with a CYTO-ID® Autophagy Detection Kit 2.0. The whole transcriptome analysis was assessed using mRNA-seq and qPCR.
4
Results
Separately, ATRA, D2, and D3 all reduced the viability of all breast cancer cell lines tested, with median inhibitory concentrations (IC50) between 2.1 to 31.7 μg/ml. However, when breast cancer cells were treated with combinations of ATRA+D2+D3, the IC50 was reduced indicating synergism. In MCF-7 cells, 5-flurouracil (5-FLU) had an IC50 of 1.37 µg/ml, while the vitamin A and D combination had an IC50 of 1.5 µg/ml, indicating the combination was ~90% as effective as 5-FLU. Treatment of MCF-7 cells with ATRA+D2+D3 enhanced caspase 3/7 activity, as well as the expression of Bax, BAD, PTEN and p53 (apoptosis canonical pathway), as well as induced autophagy. Whole genome analysis of treated MCF-7 cells showed a significant upregulation in gene expression in the autophagy, endoplasmic reticulum stress and the unfolded protein response apoptosis canonical pathways. Furthermore, MCF-7 cells treated with ATRA+D2+D3 demonstrated significant downregulation of gene expression in estrogen-mediated S phase entry and estrogen signaling canonical pathways suggesting antiestrogenic effects.
5
Conclusions
Vitamins A and D combinations had synergistic effects in breast cancer cells and induced both apoptosis and autophagy. Transcriptional profiling showed significant alterations in gene expression patterns and upregulation of multiple cancer signaling pathways supporting the hypothesis that combining vitamins A and D is a more effective treatment than either vitamin alone.
INTRODUCTION
Breast cancers (BCs) are the second most diagnosed cancer in women living in the United States, with~ 130 new breast cancer cases per 100,000 people reported annually [1]. In the US, the average risk of developing breast cancer is ~13%, with an average age at diagnosis of 62 years old [1-2]. While the risk of dying from breast cancer has declined due to early detection, screening, and better treatments, the incidence of BC continues to rise at the rate of 0.5% per year [2]. Currently, there is significant disparity in breast cancer risk and mortality in the US. There is a lowered incidence of BC in Southwestern states, as compared with Northeastern states, likely due to higher sunlight exposure and vitamin D levels [3-5]. Interestingly, recent studies have reported that the US population, particularly women, are deficient in many vitamins and minerals including vitamins A and D, vitamin C, calcium, potassium, and a variety of other micronutrients [1-2, 6-7]. These deficiencies are significant for African American and elderly women, who have higher rates of vitamin D deficiency, 76% and 70% (moderate to very severe), and an increased risk of BCs [6, 7].
Both lifestyle choices and nutrition are important factors, since the increased ingestion of fruits, vegetables, dairy, and other specific foods, reduce cancer risk [8, 9]. Over the past 30 years results from experimental, epidemiological, and human studies have shown that specific bioactive constituents present in functional foods including phytochemical, vitamins and minerals reduce the risk of cancer, and improve prognosis and patient quality of life post chemotherapy [8, 9]. Previous research reports that carotenoids, retinoids (vitamin A derivatives), and vitamin D reduce the growth of breast, bladder, head, neck, lung, prostate, and skin cancers [3-9]. In fact, data suggesting that vitamin D reduces cancer risk has been reported over the past 40 years [3-5]. In human studies, both calcitriol (1,25-dihydroxyvitamin D3), and ergosterol (vitamin D2, plant-based) reduced the risk of breast, colorectal, and prostate cancers, and postmenopausal women with vitamin D deficiencies have an increased risk of developing breast cancer [3-5, 10-13]. Moreover, low serum vitamin D levels were associated with an increased risk of breast cancer, while higher serum vitamin D levels (~52 ng/ml) were associated with a lowered breast cancer risk in premenopausal women [13, 14]. Interestingly, these associations appear to be related to the presence of the vitamin D receptor (VDR), that is expressed in healthy breast tissues where it opposes estrogen-responsive proliferation and preserves differentiation [15]. Studies in both cultured breast cancer cells and vitamin D receptor (VDR) knockout mice models show that calcitriol signaling through the VDR reduced the proliferation of mammary epithelial cells, while knockout of the VDR increases estrogen-induced proliferation, indicating that calcitriol is an important nutrient for breast cancer chemoprevention and treatment [15-19].
Other important anti-cancer nutrients present in functional foods include vitamin A derivatives. Beyond their nutritional activities, vitamin A compounds, including carotenoids, retinols, and retinoic acids (including all-trans retinoic acid, ATRA) reportedly suppress proliferation of breast, bladder, head, neck, lung, prostate, and skin cancers [20-28]. In MCF-7 cells, retinoic acid and Retinoic Acid Receptors (RAR) interacted with estrogen receptor (ER) signaling, ERα and RAR signaling had opposite effects on cell proliferation [29]. Retinoids also impact other important signaling components epidermal growth factors/TGF/insulin-like growth factor and TGFα, TGFβ1/TGFβ2, as well as MAPKs, WNT and NOTCH, PI3K/AKT and protein kinase A and C [25-27]. Thus, separately, vitamins A and D both reduce breast cancer cell growth and suppress tumorigenesis in rats and mice [23-24, 28, 30].
Several studies have shown that vitamin A and D are more effective in combination for the treatment of colon, prostate, gastric epithelial cell cancers, and leukemia [12, 31-34]. This approach is rational because of the nature of the dimerization interaction between the Vitamin D Receptor (VDR) and the RAR/RXR. The pharmacological activities of vitamins A and D are both regulated by ligand binding to their respective receptors, with retinoids binding to the RAR/RXR, and vitamin D derivative binding to the VDR [35-37]. After ligand binding, RAR/RXRs can then form heterodimers with the VDR, bind to the DNA response elements RA-responsive element and the vitamin D responsive element, thereby increasing or decreasing target gene transcriptional activation [35-37]. In one study, the combination ATRA with vitamin D increased gene expression upregulated by the VDR/RAR heterodimer [37]. The results of this study suggested that both ATRA and D3 directly interact with nuclear signaling and, when used in combination, increased gene regulation mediated through their nuclear receptors [37].
While the anti-proliferative effects of both retinoid or vitamin D derivatives have been separately reported in breast cancer, the effects and impacts of vitamin A and D combinations have not been reported for breast cancer. In this work, we demonstrate that combinations of vitamins D2, D3, and ATRA significantly reduced breast cancer cell viability than any of these compounds alone. Furthermore, transcriptomic analysis revealed that the combination of ATRA+D2+D3 upregulated multiple canonical pathways in MCF-7 cells, including autophagy and apoptosis by increasing endoplasmic reticulum stress and the protein unfolding response, as well as reducing estrogen signaling, likely explaining the enhanced effects.
METHODS
Cell Maintenance and Culture: MCF-7 and SK-BR-3 human breast cancer cell lines were obtained from American Type Culture Collection (Manassas, VA). The MCF-7 cells were cultured and maintained in minimal essential media (MEM) with 10% Fetal Bovine Serum (FBS) and 1% penicillin/streptomycin; T47D:A18 breast cancer cell line RPMI-1640 + 2 mM L-glutamine + insulin+1% NEAA and 10% FBS and 1% penicillin/streptomycin. The estrogen receptor negative SK-BR-3 human breast cancer cell line was cultured in RPMI 1640 media containing 10% FBS, 2 mM L-glutamine, 1% penicillin-streptomycin and incubated at 37°C in 5% CO2.
Cell Viability Assay: Breast cancer cells were cultured at 2.5 x 10⁴ cells per 100 μl/well in triplicate in opaque-walled 96-well plates. To determine the background luminescence, control wells in the 96 well plates contained appropriate media with 10% FBS and 1% penicillin/streptomycin but no cells. Vitamins A, D2, D3, and ATRA were purchased from Sigma-Aldrich (St. Louis, MO) and analyzed by LC/MS as we have described [32-33]. Prior to adding the vitamins, A, D3, or D2 compounds at 1-100 µg/ml in 0.01% DMSO and combinations thereof new medium was added to the wells. Wells containing drug control (5-Fluorouracil) and vehicle control (0.01% DMSO) were also prepared. The 96-well plates were incubated at 37ºC with 5% CO2. After 72 hours, 100 μl of CellTiter-Glo 2.0 Reagent (Promega Corporation, Madison, WI, USA) was added to each well and the plate processed as we have described [32-33]. A Synergy HT Plate reader (Biotek, Winooski, VT) and Gen5 1.11 software were used to measure luminescence. The median inhibitory concentrations (IC50s) were determined by using log (inhibitor) versus the normalized response analysis using GraphPad Prism 9.0. (GraphPad Software, Inc. La Jolla, CA, USA).
Apoptosis ApoToxGlo™ Triplex Assays, Caspase-Glo®3/7 and Caspase-Glo®8: MCF-7 breast cancer cells were cultured in 96-well plates (2.5 x 10⁴ cells in 100 μl/well) in triplicate and incubated overnight. ATRA+D2+D3 combinations were added to the wells at the IC50 concentration for a final volume of 100 μl per well. The Caspase-Glo®3/7 and Caspase-Glo®8 assay kits (Promega Corporation, Madison, WI, USA) were used according to the manufacturer’s protocols as we have described [33-34]. A Synergy HT Plate reader (Biotek, Winooski, VT, USA) and the Gen5 1.11 software analyzed and determined luminescence. The ApoToxGlo™ Triplex Assay kit was used according to the manufacturer’s instructions and luminescence was measured using the Synergy HT Plate reader (Biotek, Winooski, VT) and Gen5 1.11 software to detect caspase activation.
Autophagy: A Cyto-ID Autophagy Detection Kit measured autophagy (Enzo Biochem Inc., New York, NY). MCF-7 breast cancer cells in exponential growth phase were seeded in a 96-well plate at a density of 2.5 × 10⁵ cells, incubated overnight at 37°C, and then treated with D2 or D3, D2+D3, or the combination of ATRA+D2+D3 at the IC50 concentrations. Rapamycin (RPM; inducer of autophagy), and chloroquine (CLQ; a lysosomal inhibitor) were used as positive controls. After treatment, the MCF-7 cells were rinsed in PBS and resuspended in 100 µl of dual color detection solution (Cyto-ID Green and Hoechst autophagy detection reagent) and incubated at 37°C for 30 minutes. Then, the cells were rinsed twice with assay buffer and re-suspended in 100 µl assay buffer. Plate analysis was performed using a Synergy HT Plate reader (Biotek, Winooski, VT) and Gen5 software with (Excitation ~480 nm, Emission ~530) for Cyto ID green, and the Hoechst 33342 Nuclear Stain was read with a (Excitation ~340, Emission ~480).
RNA Isolation and Quality Control: Total RNA was extracted from MCF-7 cells after treatment (ATRA+D2+D3, 1.5 µg/ml) for 4 hours using Trizol (ThermoFisher Scientific, Waltham, MA, USA). The extracted total RNA samples were utilized to generate both RNA-Seq and qPCR data. RNA quantification was performed on a NanoDrop™ One Spectrophotometer (Thermo Scientific) and RNA quality was analyzed using an Agilent 4200 TapeStation and RNA Screen Tape (PN: 5067-5576). Remaining DNA levels were checked on a subset of samples using a Qubit fluorometer, and DNA levels were < 10% of the total amount of RNA.
Quantitative Polymerase Chain Reaction: Total: RNA was reverse transcribed and amplified using Power SYBR Green RNA-to-CT kit (Applied Biosystems, Foster City, CA, USA), as described by manufacturer, using a StepOne Plus Real Time PCR System (Applied Biosystems, Foster City, CA, USA). Each reaction was performed in triplicate in a 10 μl volume containing Power SYBR Green RT-PCR Mix (2X), 200 nM of each primer, RT Enzyme Mix (125x) and 100 ng RNA. The cycling conditions were 48°C for 30 minutes, 95°C for 10 minutes, and 50 cycles of 95°C for 15 seconds and 60°C for 1 minute. PCR reaction specificity was confirmed by melt curve analysis at 95°C for 15 seconds, 60°C for 15 seconds, and 95°C for 15 seconds. The quantitation of gene expression was performed using β-actin gene as an endogenous control and relative to the calibrator (control cells) using the ΔΔCT calculation. Primer sequences used were selected from previously published work and are shown in Table 1. The student T-test or one-way ANOVA followed by Tukey’s multiple comparison test as the post hoc analysis were used for the statistical analyses (GraphPad Software 9.0, San Diego, CA). Statistical significance was attributed to the data when p<0.05.

Table 1: Human primer sequences used for real-time PCR analysis are presented below and were obtained from previously published works [33-34, 38-40].
RNAseq Library Preparation, Validation and Quantification: A Universal Plus mRNASeq kit (Tecan) prepared the RNA-seq libraries as we have previously described [33-34]. Briefly, library construction was performed using 250 ng of total RNA/sample and 15 PCR cycles [33-34]. The final amplified libraries were purified, and the library fragment size distribution (range 264 and 294 nt) was determined by electrophoresis on a 2200 TapeStation system with D1000 ScreenTape. To measure the final library concentrations, PCR was performed using a KAPA Library Quantification Kit (Roche, KAPA Biosystems). The library pool was sequenced on a MiniSeq (Illumina) to determine the proportions of the individual libraries, and then they were normalized and pooled for a final concentration of 10 nM. Sequencing was performed using a NovaSeq 6000, SP flowcell with 2x50 nt reads.
Bioinformatics Statistic and Database Annotation: The Core for Research Informatics (UICCRI) at UIC performed raw data processing and used FastQC for general quality-control metrics for mRNA sequencing data as we have described [33-34]. Raw reads were aligned to human reference genome hg38 in a splice-aware manner using STAR and BWA MEM as we differentially expressed genes (DEGs) detected from RNA-seq, and FeatureCounts was used to quantify ENSEMBL genes [41-43]. Differential expression statistics for the raw expression counts were calculated using EdgeR and the exactTest function. P-values were adjusted for multiple testing using the false discovery rate (FDR; q value) correction of Benjamini and Hochberg [44]. Differentially expressed genes were classified into functional clusters using the Gene Ontology (GO) function enrichment analysis in EdgeR.
Ingenuity® Pathway Analysis (IPA): Differentially expressed genes (DEGs) were analyzed using the predicted protein function in the Ensembl database, and the canonical pathways associated with these observed changes were identified as we have previously described [33-34]. Statistically analyzed transcription data were uploaded as an Excel spreadsheet into the Ingenuity® Pathway Analysis software (Qiagen, USA) for analysis. Upregulation or downregulation of genes was filtered based on an FC of <-1 and > 1 or a Z-score of 3 and an FDR (q value) < 0.01 and used to identify canonical pathways that were mapped to the Ingenuity Pathway Analysis’s databases [33-34].
Data Sharing and Availability: The raw and processed datasets supporting the conclusions for the mRNA-seq have been deposited in the National Center for Biotechnology Information Gene Expression Omnibus repository (GEO), and they are available using the GEO number GSE221019, https://www.ncbi.nlm.nih.gov/geo.
RESULTS
Vitamin A and D combinations reduce breast cancer cell viability and upregulate the expression of proapoptotic genes: All vitamin derivatives ATRA, D2, and D3 separately reduced the viability of MCF-7, T47D:A18 and SK-BR-3 cells, with a median inhibitory concentration (IC50) of 2.1 to 31.7 µg/ml as shown in Table 2. However, when MCF-7 breast cancer cells were treated with the ATRA+D2+D3 combination, the IC50 was reduced to 1.5 µg/ml, indicating that treatment with the combination of these vitamins was more effective than treatment with only one vitamin alone (Table 2).

Figure 1A-D: A. Activation of caspase 3/7 in MCF-7 cells treated with ATRA+D2+D3 (IC50 concentration). Activation of caspase 3/7 and apoptosis induction were measured using the Caspase-Glo® 3/7 and ApoTox-Glo™ triplex assays (Promega) according to the manufacturer’s instructions. To determine caspase 3/7 activity, the resulting fluorescence was measured using a Synergy HT Plate reader and Gen5 1.11 software at 400ex/505em (viability) and 485ex/520em (cytotoxicity). Treated MCF-7 cells showed an increase in cytotoxicity with a corresponding with increased caspase 3/7 activation, and a reduction in cell viability over 72 hours. B. qPCR analysis of p53 in MCF-7 cells treated with ATRA+D2+D3 showed ~14-fold increase over control (p<0.0001). C. qPCR analysis of Bax (pro-apoptotic gene) after treatment of MCF-7 cells with ATRA+D2+D3. D. qPCR analysis of decreased the expression of Bcl-2 mRNA (anti-apoptosis gene) confirming that ATRA+D2+D3 induced intrinsic apoptosis in MCF-7 cells. Control MCF-7 cells were treated with vehicle solvent only. Statistical analysis: p53 mRNA <0.0001 in treated vs. control MCF-7 cells; Bcl-2 mRNA p<0.001 in treated MCF-7 vs. control; Bax mRNA p<0.05 in treated MCF-7 vs. control.
In MCF-7 breast cancer cells, ATRA+D2+D3 reduced cell viability, increased cytotoxicity, and induced apoptosis (programmed cell death). Treatment increased the activities of caspases 3/7 (Figure 1A), increased the mRNA expression genes associated with apoptosis, including p53 and Bax (Figures 1B-C), and reduced Bcl-2 mRNA expression (Figure 1D). The activity of caspase 3/7 showed an increase in MCF-7 cells treated with ATRA+D2+D3 up to 8 hours and then declined (Figure 1A), but no effects were observed for caspase 8 activity (data not shown). These data suggest that ATRA+D2+D3 activated the executioner caspases 3 and 7, that played a predominant role in apoptosis in MCF-7 cells. The increase in caspase 3/7 activity correlated well with a significant increase in cytotoxicity (p<0.0001) and reduction in cell viability (p< 0.01) at 4-8 hours in MCF-7 cells (Figure 1A).
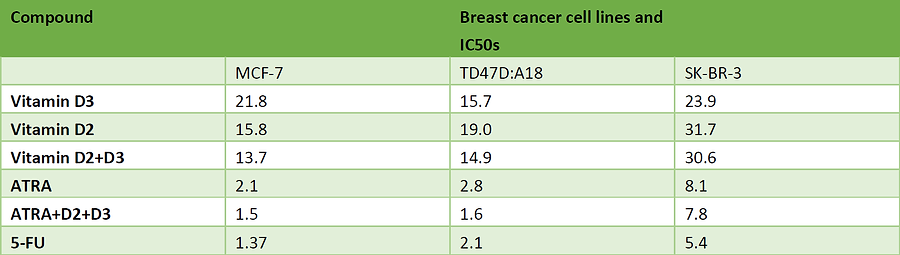
Table 2. Median inhibitory concentrations (IC50) of vitamin A and D derivatives in MCF-7, T47D:A18, and SK-BR-3 breast cancer cells.
Since the induction of caspase activity is known to alter the expression of the Bcl-2 family of proteins, favoring apoptosis, we measured the Bax (pro-apoptosis) and Bcl-2 (anti-apoptosis), as well as p53 (tumor suppressor) mRNA using qPCR. The quantitation of qPCR gene expression used the β-actin mRNA as the endogenous control gene using the ΔΔCT method. MCF-7 cells, treated with ATRA+D2+D3 at the IC50 concentration for 4 hours, showed a significant reduction in Bcl-2 mRNA expression (>90%, p<0.0001); a significant increase in BAX mRNA expression (>150%, p<0.001), and a significant increase in p53 mRNA expression (p<0.0001) indicative of the intrinsic apoptosis pathway (Figure 1B-D).
ATRA+D2+D3 induced autophagy in MCF-7 cells: The induction of autophagy was measured in ATRA+D2+D3 treated MCF-7 breast cancer cells (IC50 1.5 µg/mL), using a Cyto-ID Autophagy Detection Kit as described in methods. The results showed that for control cells (0.01% DMSO) the ~480 nm emission was zero at 480/530 nm for the Hoechst 33342 nuclear stain. MCF-7 cells were also stained with Hoechst 33342 to normalize cell number. Autophagic activity increased significantly in MCF-7 cells treated with CHQ (p<0.0001), RPM (p<0.001), D2+D3 (p<0.01), ATRA+D2+D3 (p<0.0001) (Figure 2), indicating the activation of mTOR (Figure 2). No significant effects on autophagy were seen in MCF-7 cells treated with D2 or D3 alone (Figure 2). Thus, significant activation of mTOR activation in MCF-7 cells treated with either ATRA+D2+D3 or D2+D3 at 340/480 nm, indicates the induction of autophagy (Figure 2).

Figure 2. The relative action of autophagy in MCF-7 breast cancer cells was measured using a Cyto-ID Autophagy Detection Kit. MCF-7 cells were treated for 18 hr with DMSO (0.01%, negative control) or 0.5 μM Rapamycin (RPM, positive control) or 10 μM Chloroquine (CHQ) or 0.5 μM Rap and 10 μM CHQ or D2 or D3 or D2+D3 or ATRA+D2+D3 at the IC50 concentrations, and then stained with the CYTO-ID® Green Detection Reagent. To normalize the cell number, MCF-7 cells were also stained with Hoechst 33342. The treated cells were then analyzed for excitation ~480 nm, emission ~530 nm for Cyto-ID green and excitation ~340 nm. MCF-7 cells treated with RPM or RPM+CHQ or D2+D3 or the ATRA+D2+D3 combination showed a significant increase in autophagy. No increase in the relative activity of autophagy was observed in MCF-7 cells treated with either D2 or D3 alone. Statistics were executed by using one-way ANOVA followed by Tukey’s multiple comparison test using GraphPad/Prism 9.0. **p< 0.01; ****p<0.0001 as compared with controls.
Transcriptomic analysis of ATRA+D2+D3 effects in MCF-7 cells: Total RNA was isolated from control MCF-7 breast cancer cells (DMSO 0.01%) or ATRA+D2+D3 treated cells in triplicate, purified, and then used to generate RNA-seq data. The distinct gene expression clustering between the two groups is shown in the principal component analysis (PCA) (Figure 3A).

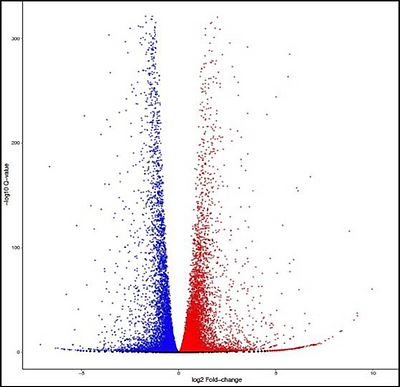
Figure 3 A and B. Differentially expressed genes from MCF-7 cells (control DMSO only) and ATRA+D2+D3 treated. A. Principal component analysis (PCA) shows results from the control (DMSO) cells (green dots) versus the MCF-7 cells treated with ATRA+D2+D3 (purple dots). The points depict the average value of one transcript and three replicates. Differential expression of gene was considered significant at a False Discovery Rate of p<0.05. B. A depiction of a volcano plot displaying the relationship between the size of the gene expression change (Log2 FC, x axis) versus the statistical significance of this change (-log10 Q-value; y axis). The plot also shows the average abundance of the 11,915 DEGs (FDR <0.05) in the MCF-7 cells treated with ATRA+D2+D3 as compared with the DMSO controls. Each point represents the average value of one transcript and three replicates. The difference in gene expression was considered significant with an FDR value of <0.05. Points are colored corresponding to their average expression, with the blue dots presenting downregulated transcripts and the red dots presenting upregulated transcripts.
The PCA plot shows different gene expression patterns between the MCF-7 DMSO control cells and the ATRA+D2+D3 treated cells, as the distinct clusters are widely separated. The RNA-seq analysis included a total of 26,048 genes, of which 11,915 were DEGs with a false discovery rate (FDR) significance (Q value) of <0.05. Expression analysis showed that 6346 genes were significantly upregulated, and 5569 were significantly downregulated. The two-dimensional stratified volcano plot (Figure 3B) shows the differentially expressed genes scattered outward away from the center of origin [35]. The volcano plot depicts the DEGs in colored points with the upregulated DEGs shown in red, while the downregulated DEGs are shown in blue. Figure 4 portrays a heatmap of the top 100 DEGs in MCF-7 breast cancer cells treated with ATRA+D2+D3 as compared with MCF-7 control cells (Figure 4). The heatmap was prepared using the top 100 DEGs with an FDR <0.01 and Z-scored Log2CPM of <-1 or > 1. Different DEG patterns are exhibited between control and treated MCF-7 cells (Figure 4), demonstrate the reliability of the DEG data.

Figure 4. The top 100 DEGs are expressed in a heatmap plot with gene ontology across data sets. There are three columns for control MCF-7 cells and three for MCF-7 cells treated with 1.5 µg/ml (IC50) of ATRA+D2+D3 for 4 hours. These columns each illustrate the value of one replicate. The blue colors of <-1 (FDR<0.01) and the red colors illustrates Z-scored Log2 CPM 1 (FDR 0.01). A gene ontology enrichment analysis depicts the functional distribution of differentially expressed genes, as well as their biological functions.
Canonical pathways impacted in the treated MCF-7 breast cancer cells: We used IPA software to determine the associations between DEGs in MCF-7 cells treated with ATRA+D2+D3 and potential canonical and biological pathways involved in the anti-cancer effects of treatment. Differentially expressed gene profiles from ATRA+D2+D3 treated MCF-7 cells were compared with that of control (DMSO 0.01%) cells. Data analysis in the Ingenuity® Pathway knowledge base of the DEGs in the treatment/control dataset versus the total number of reference genes in the canonical pathways, showed a total of 513 DEGs with a fold change of <-3 or >+3 and a false discovery rate of <0.01, with 147 gene downregulated and 366 genes upregulated. The Ensembl database and Ingenuity® Pathway core analysis software were used to assess differential gene enrichment for identifiable canonical pathways, and a significant correlation was seen between the DEGs, and 65 canonical pathways as measured by the Fisher’s exact test (p<0.01). Figure 5 shows the top 7 canonical pathways impacted after ATRA+D2+D3 treatment of MCF-7 cells were those associated with the unfolded protein response, autophagy, apoptosis signaling, the endoplasmic reticulum stress pathway, and the endocannabinoid cancer inhibition pathway as compared with control cells (Figure 5).

Figure 5. Ingenuity® Pathway Analysis of ATRA+D2+D3 treated MCF-7 cells showed 65 significantly altered canonical pathways, with seven of the top up- and down-regulated pathways shown.
ATRA+D2+D3 significantly alters DEGs in the protein unfolding, endoplasmic reticulum stress and autophagy canonical pathways in MCF-7 breast cancer cells: Whole cell genome analysis of MCF-7 cells treated with ATRA+D2+D3 revealed that numerous canonical pathways associated with the inhibition of MCF-7 cell growth, including apoptosis, autophagy, the endoplasmic reticulum stress and the unfolded protein response (UPR; Figure 6). Other important canonical pathways associated with breast cancer, including the estrogen-mediated S phase entry (EMSP) and the estrogen receptor indicating canonical pathways were downregulated (Figure 6 and 7, Supplemental Figure 1).
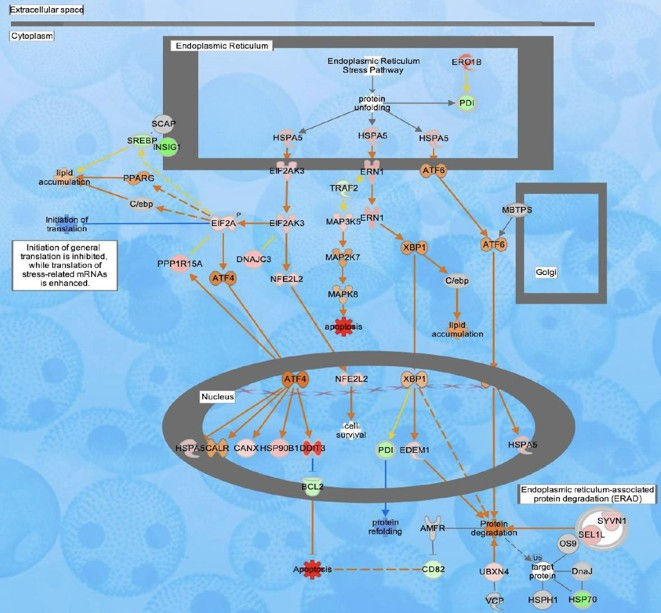
Figure 6. The unfolded protein response (UPR) and endoplasmic reticulum stress (ERS) canonical pathways were the first and third canonical pathways upregulated in MCF-7 cells treated with ATRA+D2+D3. The genes and events depicted in red/pink/orange show significant up-regulation, while genes and events depicted in green/blue show notable downregulation. Of the 90 genes associated with the UPR, 40 were differentially expressed after ATRA+D2+D3 treatment, but only genes having a Log2 fold change > ±3 and a false discovery rate of < 0.01 were included. In the ERS canonical pathway, 11 of the 21 genes were differentially expressed in treated MCF-7 cells.

Figure 7. The estrogen-mediated S-phase entry (EMSP) canonical pathway was significantly downregulated (p<0.01) in ATRA+D2+D3 treated MCF-7 breast cancer cells treated with ATRA+D2+D3. DEGs and events depicted in red/pink are significantly upregulated, and DEGs and events highlighted in green/blue are significantly downregulated. Of the 26 genes in the EMSP pathway, 25 DEGs. In this figure, only DEGs with a Log2FC > ±1 and an FDR < 0.01 were included in this figure. Of the 409 genes in the estrogen receptor signaling pathway, 189 were significantly downregulated and 175 were upregulated (data not shown).
ATRA+D2+D3 reduces gene transcription in the estrogen receptor signaling and estrogen-mediated S-phase canonical pathways: In ATRA+D2+D3 treated MCF-7 breast cancer cells, the Estrogen-mediated S-phase entry (EMSP) and the estrogen receptor signaling (ER) canonical pathways were significantly downregulated (p<0.01, Figure 7).
DISCUSSION
For decades it has been well known that food products and their bioactive nutrients and constituents have functions beyond their nutritional value and are important for their positive effects on the immune system and disease prevention [8-9]. Recent studies have reported that a high percentage of the global population is micronutrient deprived due to a deficiency of dietary vitamins and minerals leading to an increase in chronic diseases, including cancer [45-46]. Reviews of vitamin D and other micronutrients have shown that these compounds are essential for the prevention of upper respiratory infections, including Covid 19, coronary heart disease, neurological disorders and cancer [45-46]. For example, the anti-proliferative effects of vitamin A on gastric cancer were first reported in 1926, and the anti-cancer effects of vitamin D were reported in the 1980s [4, 23-24]. Since then, numerous in vitro and in vivo investigations have shown that vitamin A and D derivatives alone reduced the growth of cultured breast cancer cells and inhibited the growth of tumors in various xenograph models [3, 19, 20-28, 30]. Moreover, human studies involving postmenopausal women show an association between vitamin D deficiencies and an increased risk of the development of breast cancer [13, 14]. Although the clinical trial data for vitamin A alone have had mixed results, it has been suggested that the clinical trial designs, length of the studies, the doses and protocols used in these studies were not optimal and did not account for breast cancer heterogeneity or select for any specific sub-type of breast cancer [24, 27]. More recently, it has been reported that combinations of vitamins A and D have synergistic effects in colon and prostate cancers and were more effective in reducing cancer cell growth and xenograph tumors, than either vitamin alone [31, 33, 34]. While vitamins A and D have been tested separately in breast cancer, the combined effects of vitamins A and D in breast cancer cell lines, and the impact of these combinations on canonical signaling pathways, had not been previously investigated.
In this work, we have shown that ATRA, vitamin D3 or D2, separately, reduced the viability of MCF-7, SKBr3 and T47D:A18 breast cancer cells, and further demonstrated that the ATRA+D2+D3 combination had synergistic effects, and suppressed the proliferation of breast cancer cells at lower IC50 concentrations than any of the vitamins alone. Interestingly, a vitamin D2 and D3 combination was also synergistic and reduced the viability of both MCF-7 and T47D:A18 cells, as compared with either vitamin D2 or D3, separately. When D2 and D3 were combined with ATRA, the IC50 was reduced to 1.5 μg/ml in MCF-7 cells, that was similar to the effects of 5-FU (IC50 1.37 μg/ml) in this cell line. The combination was more effective in MCF-7 and T47D:A18 cell lines than in SK-BR-3 cells, perhaps due to the presence of estrogen receptors in MCF-7 and T47D:A18 cells, as the SK-BR-3 cell line is estrogen receptor negative. Treatment of MCF-7 cells with ATRA+D2+D3 significantly increased cytotoxicity and the activity of caspase 3/7 at 2-8 hours, indicating apoptosis. At the IC50 concentration, the combination of ATRA+D2+D3 reduced MCF-7 cell viability by inducing both apoptosis and autophagy. PCR analysis of genes associated with apoptosis indicated that the ATRA+D2+D3 combination altered the expression of genes involved in intrinsic apoptosis (Bcl-2, Bax, p53) in MCF-7 cells. These data correspond well with those of Donato and Noy [47] who reported that retinoic acid (RA, alone) inhibited MCF-7 cell proliferation by inducing apoptosis, and further showed that RA also induced the expression of several pro-apoptotic genes, including caspases 7 and 9. ATRA was also reported to upregulate the expression of caspase-8, Fas, and tumor necrosis factor α (TNFα), thereby invoking extrinsic apoptosis [48-49]. While our results did not show changes in caspases 8 or 9 activities or expression, we did observe a significant upregulation of TNF mRNA (Supplemental Figure 1). Other investigators have reported that ATRA treatment (alone) of breast cancer cells lines downregulated the expression Bcl-2, cdk2, and cyclin D1 mRNAs and proteins [50-53]. Conflicted results have been reported for ATRA’s effect on the expression of tumor suppressor p53 as it is related to apoptosis [54]. In normal human breast cells, apoptosis was reported to be independent of p53 expression, but in cultured human HepG2, HCT-116, and MCF-7 cells, ATRA-induced apoptosis through a p53-dependent mechanism. [54]. Our data showed that ATRA+D2+D3 treatment of MCF-7 cells, significantly (FDR <0.05) upregulated the expression of the mRNAs for both tumor suppressors p53 and PTEN (Supplemental Figure 1).
Whole transcriptome analysis showed that gene expression was significantly increased in multiple canonical pathways associated with apoptosis, particularly the unfolded protein response (UPR), the endoplasmic reticulum (ENDR) stress, and the endocannabinoid cancer inhibition pathways in ATRA+D2+D3 treated MCF-7 cells (Figure 5). ENDR is an intracellular organelle located adjacent to the cell nucleus and responsible for the proper folding and post-translational modification of proteins [55-56]. ENDR stress occurs when proteins are misfolded, causing a disruption of the normal physiological functions of the cell, and leading to an increase cell stress and cell death (apoptosis). The UPR is a highly conserved canonical pathway that adjusts protein-folding to re-establish ENDR homeostasis and is regulated through a series of stress sensors in the EDNR membrane including the activating transcription factors 4 and 6 (ATF4 and 6), inositol-requiring enzyme 1α (IRE1α; ERN1 gene), and pancreatic endoplasmic reticulum kinase (PERK; EIF2AK3 gene) [55-56]. Persistent, unattenuated unfolded protein response (UPR) leads to chronic ENDR stress that increases cell apoptosis, by inducing CHOP (transcription factor C/EBP homologous protein) expression [55-56]. Analysis of our RNA-seq data showed that CHOP (DDIT3 gene product; Figure 6) was significantly upregulated as well as other important gene products in the UPR pathway, including IRE1, ATF4 and PERK. Induction of CHOP, activates caspases and increases the expression of the pro-apoptotic Bcl-2 proteins, thereby activating apoptosis. Upregulation of CHOP expression also induces transcriptional repression of Bcl-2 (anti-apoptosis) that further contributes to cell death [57]. Our data supports these observations and further suggests that the combination of ATRA+D2+D3 induces MCF-7 cell apoptosis through upregulation of the UPR due to persistent ENDR stress.
The UPR has also been associated with autophagy, another canonical pathway that was significantly upregulated in our analysis (Supplemental Figure 1). Autophagy is a cellular process associated with the removal of unwanted or damaged organelles and proteins to assist in cell survival during chemical or drug treatments, hypoxia, or nutrient deprivation [56]. During EDNR stress, the sensors IRE1 and PERK induce the phosphorylation of the two autophagy inhibitory proteins, Bcl-2 and Bcl-XL, inactivating them and inducing autophagy [56-58]. Furthermore, PERK activation is reported to increase both CHOP and ATF4, resulting in inhibition of AKT and mTOR, increasing autophagy [57-58]. We found that both the mammalian target of rapamycin (mTOR gene) and the regulatory-associated protein of mTOR (RPTOR gene) were significantly downregulated in MCF-7 cells treated with ATRA+D2+D3 (Supplemental Figure1). Thus, analysis of whole-genome transcriptomic profiling suggests that the primary canonical pathways leading to the induction of apoptosis and autophagy in ATRA+D2+D3 treated MCF-7 cells include the unfolded protein response and endoplasmic reticulum stress pathways.
Finally, estrogen receptor positive (ER+) breast cancer is currently the most diagnosed form of breast cancer in the US, with > 70% of BCs being ER+ [1]. Reports from in vitro studies show that retinoids or vitamin D (alone) inhibited breast cancer cell proliferation but further suggested that they may be more effective in ER+ breast cancer cells [59-60]. ERα agonists, including 17β-estradiol (E2) increased the proliferation of ER+ breast cancer cells, while the growth of ERα positive cell lines MCF7/BUS and U2OS-ERα-Luc was reduced after ATRA treatment [60]. Signaling through the ERα and RAR/RXR appears to have inverse effects in breast cancer growth, as RAR/RXR activation reduces BC cell growth, while ERα signaling increases BC cell proliferation [60]. Calcitriol has been reported to downregulate the expression of the ER and the aromatase gene (CYP19A1; an enzyme that synthesizes estrogen from androgenic precursors) in MCF-7 cells [61, 62]. Our results demonstrate that ATRA+D2+D3 treatments downregulated two genes involved in the synthesis of estrogens in MCF-7 cells. The gene for steroid sulfatase was downregulated by 2.5-fold (p<0.01) and 17β-hydroxysteroid dehydrogenase type 1 (HSD17β1 gene) was downregulated by 5-fold (p<0.01), however we did not find any alterations in aromatase expression. The enzyme steroid sulfatase regulates the hydrolysis of estrone sulfate to estrone, which can then be reduced to form active estradiol and stimulate the growth of estrogen positive breast cancers [63-64]. The HSD17β1 gene is expressed in ovary, endometrium, and breast, and has been implicated in estrogen-dependent diseases, such as breast cancer [64]. Knock down of 17β-HSD1 and -7 in T47D and MCF-7 cells reduced cell viability by 35.8% and 29.3%, respectively indicating a central role for this enzyme in MCF-7 cell proliferation [65]. In humans, HSD17β1 is overexpressed in breast cancer tissues and inhibition of 17β-HSD1 led to tumor shrinkage in xenograph models [64]. In this work, transcriptomic analysis further suggested that ATRA+D2+D3 treatment of MCF-7 cells suppressed estrogen signaling by significantly downregulating genes associated with estrogen synthesis, as well as in the estrogen-mediated S-phase entry (EMSP; Figure 7) and the estrogen receptor signaling (ER) canonical pathways (p<0.01). The overall effects of reducing estrogen synthesis and signaling in MCF-7 breast cancer cells would likely contribute to the mechanisms by which vitamin A and D combinations inhibit breast cancer cell proliferation.
Since estrogens are the most important driving factor of hormone-positive cancers, nutritional therapies that reduce estrogen signaling would not only be significant for treatment, but also for potential use as chemoprevention agents. Considering that ~50% of women are deficient in vitamin A and >70% are deficient in vitamin D (especially elderly women and women of color), the results of this study confirmed in an animal model of breast cancer would be significant and would potentially offer a low cost, safe and effective means of reducing breast cancer prevalence.
CONCLUSIONS
Various epidemiologic studies have shown an association between vitamins A and D and health outcomes, including cancer-related morbidity and mortality. One systematic review and meta-analysis concluded that low serum vitamin D levels and intake were inversely related to BC occurrence in the general population [19]. Similar reports suggest that the ingestion of retinoids is also inversely associated with BC risk. Our data suggest that vitamins A and D combinations are synergistic and reduced cell viability in breast cancer cell lines, by inducing autophagy and apoptosis in MCF-7 cells. Transcriptomic profiling showed significant alterations in gene expression patterns and upregulation of multiple cancer signaling pathways supporting the hypothesis that combining vitamins A and D is a more effective treatment than either vitamin alone. During the past 20 years, deficiencies in vitamins A and D have now become a pandemic worldwide, and as the rate of breast cancer continues to increase, it is critical that more research in this field should be undertaken to understand the detrimental effects of vitamin deficiencies more fully in BC and other forms of cancer.
List of abbreviations: ATF: activating transcription factors, ATRA: all trans-retinoic acid, BC: breast cancer, Bcl-2: B-cell lymphoma 2, Bax: bcl-2-like protein 4, BIM: Bcl-2-like protein 11, CHOP: UPR-induced transcription factor C/EBP homologous protein, CHQ: Chloroquine, D2: ergocalciferol, D3: cholecalciferol, DEG: differential expressed genes, EMSP: estrogen-mediated S-phase entry, ENDR: endoplasmic reticulum, ER: estrogen receptor, FC: Fold change, FDR: false discovery rate; HSD17β1: 17β-hydroxysteroid dehydrogenase type 1, IPA: Ingenuity Pathway Analysis, IRE1α: inositol-requiring enzyme 1α, PCA: principal component analysis, P53: p53 tumor suppressor, qPCR: quantitative polymerase chain reaction, PERK: pancreatic endoplasmic reticulum kinase, RA: retinoic acid, RAR/RXR: retinoic acid receptor, RPM: Rapamycin, UPR: unfolded protein response, VDR: vitamin D receptor.
Authors’ contributions: GBM, ZA, MMC and NAR were responsible for the research design and conducted the research. TOL, SP and NAR grew, treated and harvested the breast cancer cells, SP and TOL isolated RNA, and analyzed data. NSL and ZA performed the RNA purification, mRNA-seq; PNK and MMC performed the bioinformatics and statistical analyses. GBM performed IPA analysis. All authors were involved in writing and editing the manuscript.
Competing interests: The authors state that there are no conflicts of interest.
Acknowledgements and Funding: We would like to show recognition and appreciation for the generous educational sponsorship from the First Analysis Institute of Integrative Studies (GBM) and a research grant from the Regenstein Foundation (GBM); a Postdoctoral fellowship award from the Schlumberger Foundation (TOL/GBM); and a Raman Post-Doctoral Fellowship by the University Grants Commission, Govt. of India to (NAR/GBM). PK and MMC were supported partly by the University of Illinois at Chicago (UIC) Center for Clinical and Translational Science (CCTS) through Grant UL1TR002003. We would also like to gratefully acknowledge F. Oliver Nicklin at the First Analysis Institute of Integrative Studies for the theoretical conferences, as well as his support with hypothesis generation and the direction of the work. The contents are primarily the responsibility of the authors and do not necessarily represent the official views of the funding agencies.
For a full list of references, please download the pdf.